1. Willam test overview#
The objective of the test proposed by Willam et al. (cf. [Bib 2]) is to observe the response of the model when the load’s own coordinate system rotates. This test is purely theoretical and it is unlikely that experimental results will ever be available for this test, given the difficulties associated with studying the fracture of concrete under tension. Its major interest is to compare the influence of the description of damage anisotropy on the response of the material compared to isotropic models.
This test is the succession of two loading phases:
First phase: simple traction. We impose \(\Delta {\varepsilon }_{\text{xx}}\) until non-linearity, that is to say the start of traction damage.
Second phase: starting from the deformation state at the end of the first phase, two tensile loads and one shear load are imposed on the tensile loading plane with the following proportionality coefficients:
\((\Delta {\varepsilon }_{\text{xx}},\Delta {\varepsilon }_{\text{yy}},\Delta {\varepsilon }_{\text{xy}})\mathrm{=}(0\text{.}\mathrm{5,}0\text{.}\text{75},0\text{.}5)\).
The Figure 1-a shows us the evolution of the various components of the stress as a function of the deformation \({\varepsilon }_{\text{xx}}\). We can distinguish 4 phases in behavior:
Phase 1 is the elastic phase under uniaxial loading.
Phase 2 corresponds to the growth of damage in a particular direction. Stress \({\sigma }_{\text{xx}}\) decreases insofar as the damage is first initiated along the \(x\) axis. Stress \({\sigma }_{\text{yy}}\) does not increase linearly, which indicates that the damage coordinate system is rotating.
Phase 3 begins when there is total damage in one direction. The damage reference frame is then blocked as seen on Figure 1-b, which shows the evolution of the angle between the damage’s own coordinate system and the initial coordinate system (as well as the angle between the deformation coordinate system and the initial coordinate system). During this phase 3, elastic behavior is observed.
Phase 4 then begins when damage in the direction orthogonal to the blocked direction is initiated. A softening of the stresses caused by the growth of the damage is then observed.
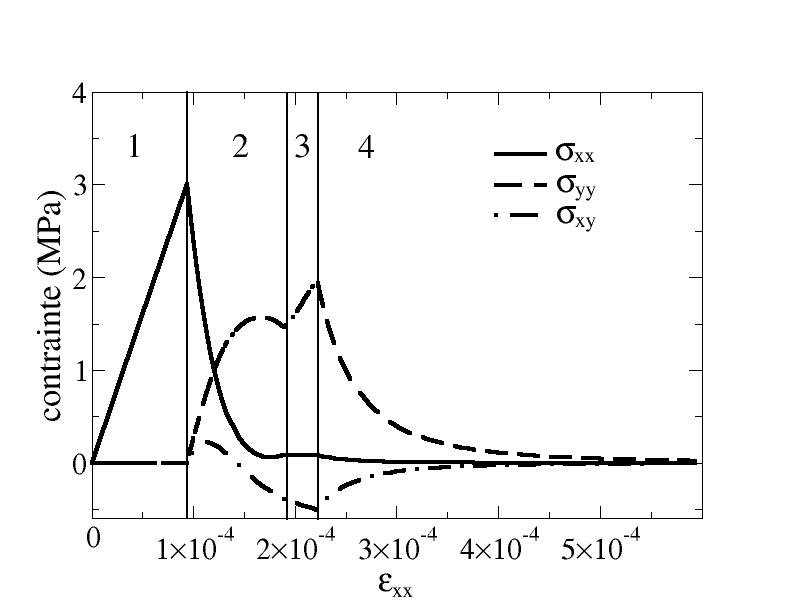
Figure 1-a Evolution of the constraints for the William test
It is also noted on the Figure 1-b that the damage coordinate system does not rotate in the same way as the deformation coordinate system. This is due to the fact that the law of evolution of damage is not written as a function of deformations but as a function of thermodynamic forces, which depend on both the state of deformation and the damage. Since the Willam test is a theoretical test, it is difficult for us to make a precise judgment on this prediction of the ENDO_ORTH_BETON model.
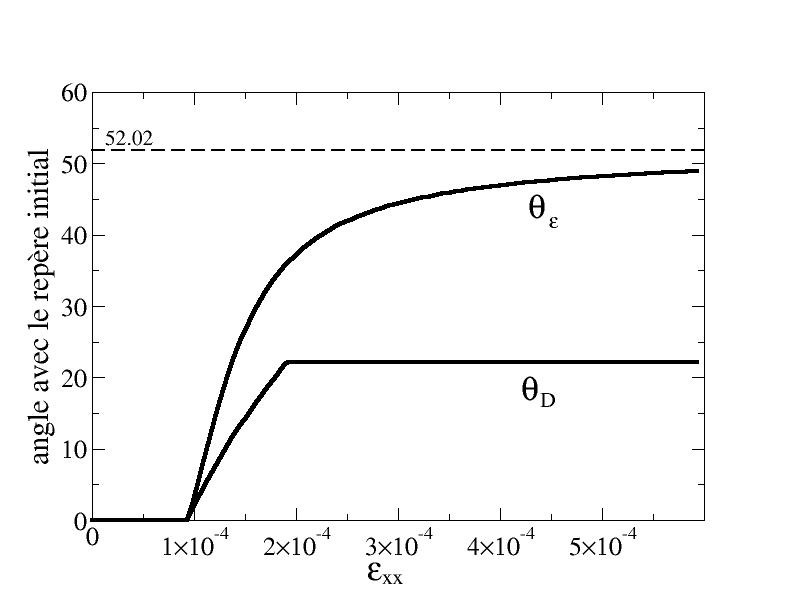
Figure 1-b Evolution of the angles of the natural reference frames of deformations and damage compared to the initial coordinate system
The behavior obtained with our model for the Willam test seems characteristic of what can be expected from anisotropic models (cf. [Bib 3]). The main difference, compared to Carol’s results [1999], lies in the blocking of the natural coordinate system that is observed with the ENDO_ORTH_BETON model when the damage is complete in one direction, which does not appear in [Bib 3].