3. Modeling A#
3.1. Characteristics of modeling#
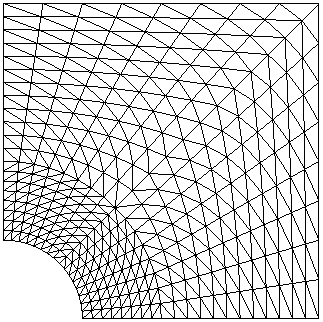
3.2. Characteristics of the mesh#
Number of knots: 357.
Number of meshes and types: 640 TRIA3.
3.3. Tested values#
Identification |
Reference |
Aster |
% difference |
tolerance |
A
|
2.823 |
—5.91 |
0.1 |
|
ZZ2 |
2.884 |
—3.85 |
0.1 |
|
ZZ1 |
0.261 |
0.3 |
||
ZZ2 |
0.207 |
0.3 |
||
ZZ1 |
—7.4 10—3 |
0.1 |
||
ZZ2 |
—6.1 10—2 |
0.1 |
||
P
|
1.15625 |
1.152 |
—0.37 |
0.1 |
ZZ2 |
1.15625 |
1.145 |
—0.98 |
0.1 |
ZZ1 |
—0.15625 |
—0.150 |
—3.81 |
0.1 |
ZZ2 |
—0.15625 |
—0.145 |
—7.00 |
0.1 |
ZZ1 |
—0.125 |
—0.117 |
—6.11 |
0.1 |
ZZ2 |
—0.125 |
—0.124 |
—0.68 |
0.1 |
M1
|
1.33 10—4 |
1.10—3 |
||
ZZ2 |
8.13 10—5 |
1.10—3 |
||
ZZ1 |
6.63% |
0.1 |
||
ZZ2 |
4.05% |
0.1 |
||
ZZ1 |
0.445 10—2 |
0.424 10—2 |
—4.76 |
|
ZZ2 |
0.445 10—2 |
0.451 10—2 |
+1.31 |
|
ZZ1 |
3.44% |
3.28% |
||
ZZ2 |
3.44% |
3.49% |
||
ZZ1 |
0.952 |
|||
ZZ2 |
1.013 |
|||
3.4. notes#
is the estimator’s effectiveness index.
Contents of the results file:
global absolute and relative errors by the 2 methods,
maximum and minimum values of stresses and errors,
lists of cells where the relative error is greater than 10%.