4. B modeling#
4.1. Characteristics of modeling#
Interfaces and cracks are defined by level sets.
The distance indicator provided by RAFF_XFEM is used.
The advantage of this modeling is to present a methodology that is more optimal than that used in modeling A. The idea is to better control the number of cells to be refined and the size of the cells at the end of the refinement process.
Knowing the initial size of the cells, and by setting a target size, we will refine as many times as necessary in order to obtain adequate size cells in the areas of interest.
4.2. Characteristics of the mesh#
The initial mesh is healthy: it consists of \(20\times 20\) linear quadrangles, which are cut in half in order to obtain triangles (see explanation in § 3.3). This mesh is shown on the.
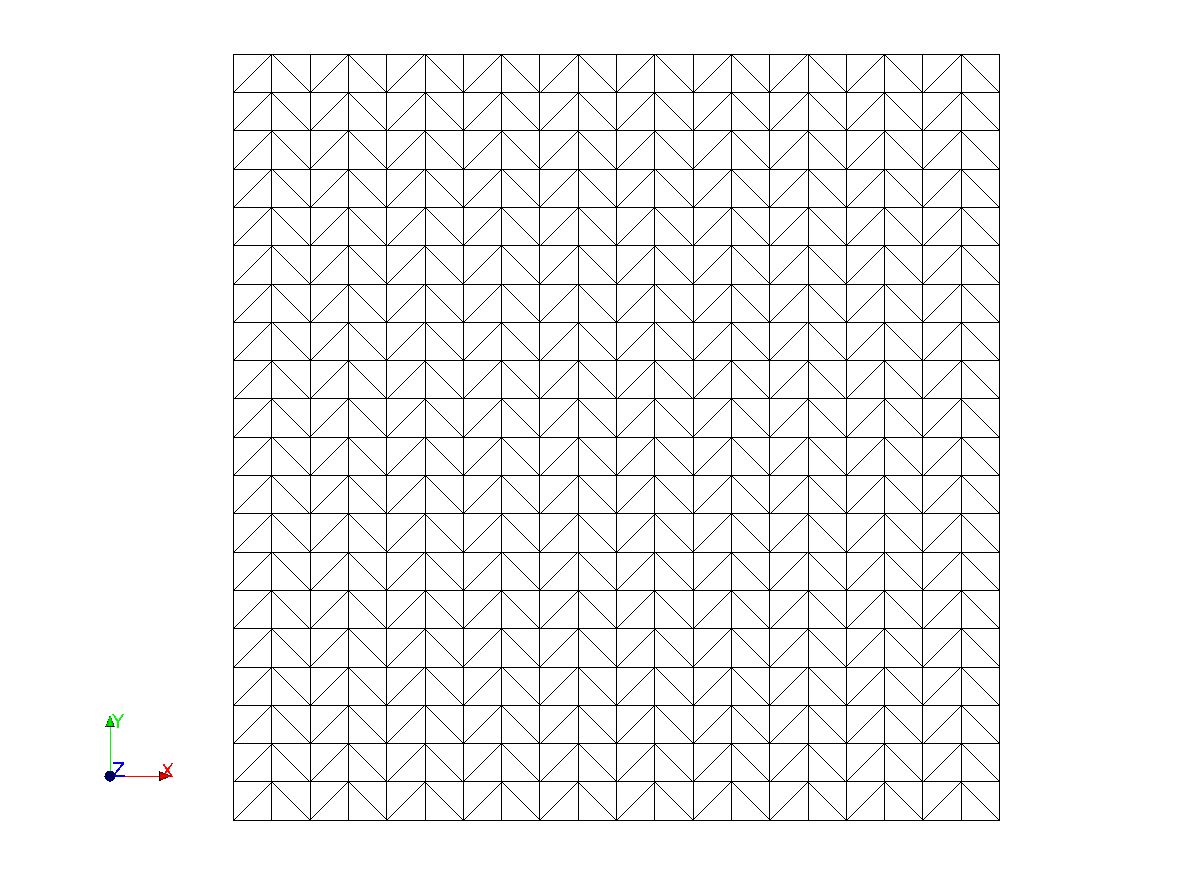
Figure 4.2-1: initial healthy mesh
The refinement procedure as described in [U2.05.02] is applied for the distance indicator. This procedure makes it possible to better control the size and the number of meshes with refinement. After refinement, the mesh shown on the is obtained. It is interesting to note that the cells strictly included in the zone of interest (for example around bottom No. 1 of the crack centered at A) do not all have the same size (see).
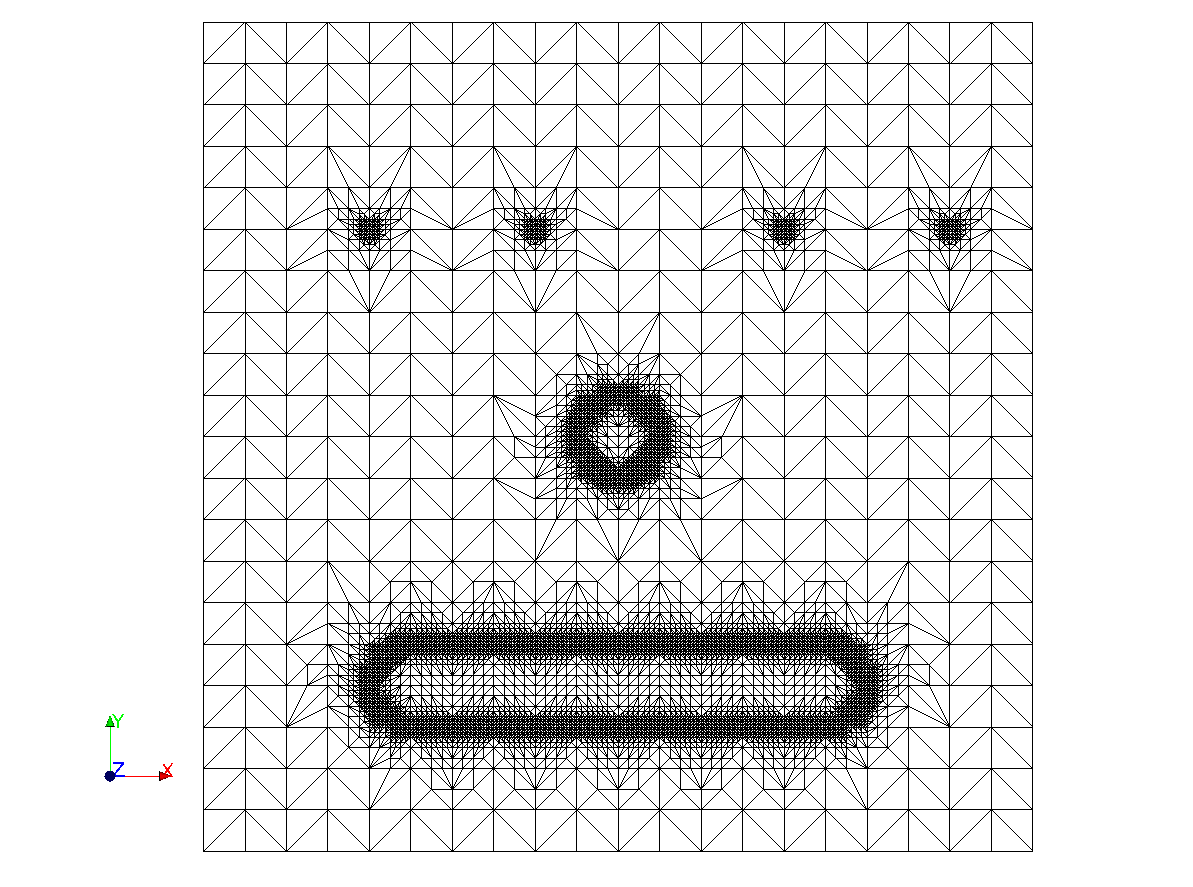
Figure 4.2-2: refined healthy mesh
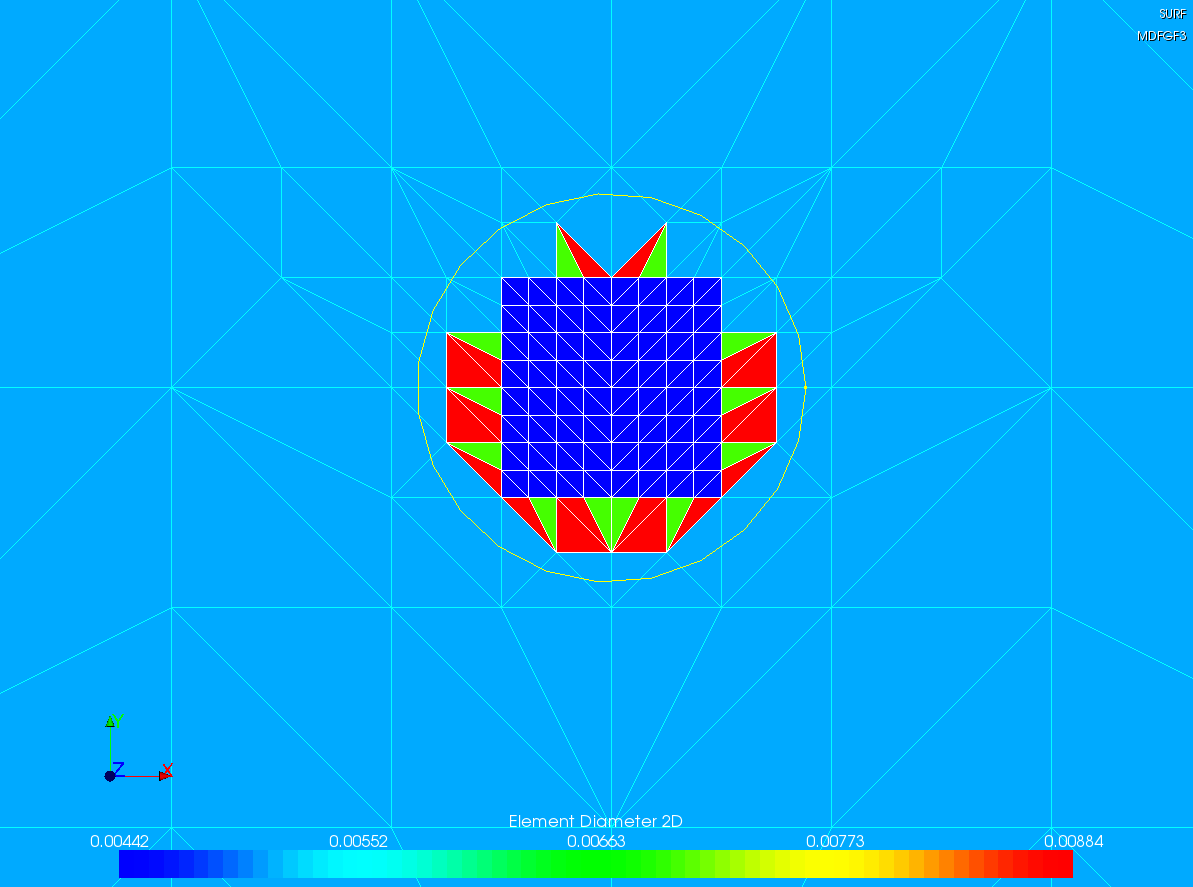
Figure 4.2-3: refined healthy mesh - zoom around the bottom of crack No. 1 of the crack centered at A and size map in the area of interest
4.3. Tested sizes and results#
The value of the minimum mesh size is tested.
Identification |
Reference |
Reference type |
\(\text{\%}\) tolerance |
\(\mathit{min}(h)\) |
0.004419 |
“ANALYTIQUE” |
0.1% |
This test will be improved when we can better test the maps.