2. Introduction#
The model described here is the so-called modified Cam-Clay model. The initial Cam-Clay model was developed by the Cambridge School of Soil Mechanics in the 1960s. It predicted excessive deviatory deformations under low deviatoric loading, and was modified by Burland and Roscoe in 1968 [bib1].
2.1. Phenomenology of soil behavior#
Poroplastic materials such as certain clays are characterized by the following behaviors:
the high porosity of these materials causes irreversible deformations under hydrostatic loading corresponding to a significant reduction in porosity. This purely contracting mechanism is sometimes called « collapse »,
under deviatoric loading, these materials show a contracting phase followed by a phase where the material deforms at a constant plastic volume or expands.
For both types of loading, the energy blocked in the material changes according to the number of contacts between the grains. For a hydrostatic loading, the number of contacts increases, as well as the blocked energy, so we have positive work hardening. For deviatory loading, the material can be deformed without volume variation at a constant number of intergranular contacts. In addition, in the tests, locations of deformations accompanied by a strong dilatance can be observed. In these areas, as the number of grains in contact decreases, there is a decrease in blocked energy and therefore softening.
These behaviors are demonstrated essentially by triaxial revolution tests. These observations lead to the hypothesis that there is a plastic threshold whose evolution is governed by two mechanisms: one purely contracting associated with hydrostatic stress, and a deviatoric mechanism governed by internal friction taking place at a constant volume and possibly expanding as the location approaches.
The whole advantage of the Cam Clay model lies in its ability to describe these phenomena with a minimum of ingredients and in particular a single load surface and work hardening associated with a single scalar variable.
2.2. Behaviour under hydrostatic compression#
During a hydrostatic compression test, soils have a void index that decreases logarithmically with the hydrostatic pressure exerted (cf. [Figure 2.2-a]). \({e}_{0}\) being the index of initial voids under initial load. Up to a pressure \({P}_{\text{cons}}^{0}\) called consolidation pressure, the behavior is reversible, the slope \(\kappa\) in diagram \((e,\text{Ln}P)\) is called the elastic swelling coefficient. \({P}_{\text{cons}}^{0}\) corresponds to the maximum pressure that the material has been subjected to over the course of its history. Beyond this preconsolidation, the diagram shows a new slope \(\lambda\) (compression coefficient) that is more pronounced and the appearance of irreversible deformations. \({P}_{\text{cons}}^{0}\) therefore corresponds to an evolving elastoplastic threshold.
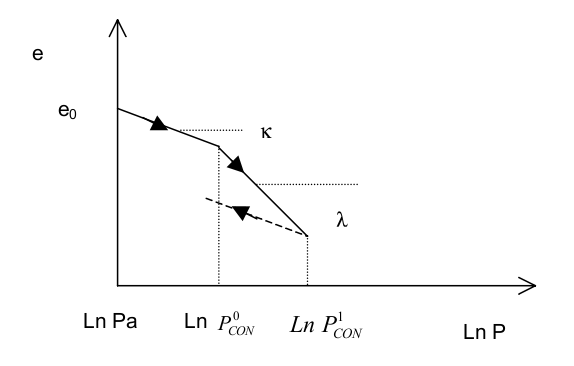
Figure 2.2-a: Hydrostatic loading-unloading test
Note:
The diagram above corresponds to a set of measures where the effective stress is stabilized. In fact, in the process of soil consolidation, it is the water contained in the pores that first takes up the hydrostatic pressure with very little deformation, before flowing out and allowing the skeleton to deform. After consolidation of the material and stabilization of the water pressure, the effective stress (total stress minus water pressure) is stabilized and reported on the graph. Behavioral relationships in saturated porous media are generally expressed with effective constraints according to the Terzaghi hypothesis.
2.3. Behaviour under deviatoric loading#
Triaxial revolution tests make it possible to control both the deviatory component \(Q\) and the spherical component \(P\) of the load. Depending on the ratio of these two components, a purely dilating (\(\frac{Q}{P-{P}_{\text{trac}}}>M\)) or contracting (\(\frac{Q}{P-{P}_{\text{trac}}}<M\)) plastic behavior is observed, the line \(Q=M({P}_{\text{cr}}-{P}_{\text{trac}})\) representing all the critical points on the load surfaces where the mechanical state evolves without changing the plastic volume. Cam Clay’s basic model assumes that plastic deformation rates are normal at load surface \(f\) (\({\dot{\epsilon }}_{v}^{p}=\dot{\Lambda }\frac{\partial f}{\partial P},{\tilde{\dot{\epsilon }}}^{p}=\dot{\Lambda }\frac{\partial f}{\partial Q}\)). In addition, plastic work at any point on the load surface is considered equal to plastic work in the critical state.